This article examines CEO executive compensation at Alberta Treasury Branches (ATB Financial) since it became a provincial agency or Crown corporation, in 1997. The focus of this article is how the return on capital or equity and the pay of the CEO are related over a 23-year period. Also, the question of fairness of compensation in relation to compensation of senior government officials, average ATB salaries, and the CEO of Canadian Western Bank (CWB) is canvassed.
[The data used is the total of salary and benefits or total compensation and comes from ATB’s annual reports. A separate PDF of the article and PowerPoint/PDF of the figures is produced at the bottom of the article for better viewing of the charts.}
Background
In 1994, Treasurer Jim Dinning was facing persistent and difficult questions from the Liberal Opposition party about the loan guarantee issued in favour of West Edmonton Mall by Alberta Treasury Branches. As the controversy swirled (which led to an investigation by the Auditor General Peter Valentine), Dinning tapped Gordon Flynn, a respected Calgary tax lawyer to draft a set of recommendation on the structure and mandate of ATB. The report was delivered in December 1994 and Dinning referred the report to the “Treasury Branches Working Group” led by Don Mazankowski. These actions led to amendments to the Treasury Branches Act in 1995 establishing a board of directors, an audit committee, and the position of President and Chief Executive Officer.
Once the amendments were proclaimed, an extensive search for directors was launched and the new board was announced in March 1996. Marshall Williams (who had led the government’s Financial Review Commission in 1994), was appointed as Chair. In a letter to Williams, Dinning directed ATB to operate independently of government and in a commercial manner (like the banks), and to “optimize” profit. In September 1996 the board hired a new CEO, Paul Haggis, at a salary roughly double that of his predecessor.
 Paul G. Haggis, President and CEO, 1996-2000 Source: Bank of Canada
By October 1997 the new Alberta Treasury Branches Act was proclaimed giving ATB provincial agency status outside the constraints of public sector pay controls. As the figure below shows, ATB’s average salary has increased by 260 per cent in nominal terms over the past 23 years.

The Act also granted ATB more business powers to establish subsidiaries in the wealth management area more in keeping with its competitors’ powers.
Importance of Capital
Capital in any business is the amount of money that owners of an enterprise place at risk. One simple method of measuring the performance of the business and its CEO is by comparing the net income generated by the business with the amount of capital (also known as equity) employed in the business. We use the retained earnings of ATB as the equity, for reasons described below. The return on capital or equity (ROE) is important because at the end of June 2020, Alberta taxpayers’ investment in ATB was $3.638 billion. An additional measure used to compare CWB and ATB CEO performance (below) is the return on average assets, commonly used in the banking industry.
At the time the new Act was proclaimed a capital adequacy requirement was instituted similar in nature to the requirements under the federal Bank Act. For deposit-taking financial institutions, capital adequacy is important because these institutions borrow many times the size of its capital in the form of deposits which are loaned out or invested for liquidity purposes. Equity capital is the first cushion in meeting losses from credit decisions gone bad. Since ATB’s capital was in a deficit position in 1997, the Regulations created “notional capital” of $600 million to be reduced by the net income generated by future net income. This meant the government did not have to put any real money into ATB.
This $600 million figure approximated what ATB, if a chartered bank, needed to meet the existing capital test. Why this approach? The approach created the impression that 1) ATB was adequately capitalized like its competitors, and 2) with capital, performance could be measured against its competitors and therefore CEO performance could also be measured against competitors. Most important however was to put in place a discipline to ensure ATB’s loans would not outpace its capacity to cushion losses. By 2003, ATB fully met the capital requirements without notional capital. ATB’s capital base in these early years grew almost entirely through net income which became retained earnings (See Chart below).
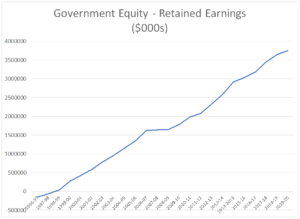
Retained Earnings- Alberta taxpayers’ investment in ATB
Since 1997 there have been changes to the capital structure of ATB notably in the wake of the 2007-09 financial crisis when ATB faced high credit provisions due to its investments in non-bank Asset-Backed Commercial Paper (ABCP). In addition, ATB’s investment management subsidiary had to make money market fund holders whole due to its heavy investments in the impugned ABCP. Regulatory changes in 2009 allowed ATB to count new notional capital of $600 million in its ‘Tier 2’ capital (Tier 2 capital includes weaker, less permanent forms of capital such as subordinated debentures and general loan loss provisions).
The last major change to ATB’s capital structure and its capital adequacy requirements came in 2015 when the provincial economy went into a recession due to collapsing oil prices. In his 27 October 2015 budget Joe Ceci announced that the Government was going to “increase the capital available to ATB Financial by $1.5 billion with the goal of steadily increasing the capital available to loan, on commercial terms but with a clear commitment to building Alberta.”

In the 2016 financial statements, a whole new form of Tier 2 capital had been created called “Wholesale Borrowings” with a value of $980 million or about 19 per cent of total wholesale borrowings. By 2020, wholesale borrowings of $2 billion, eligible for Tier 2 capital, accounted for nearly 50 per cent of total wholesale borrowings. On the very last day of the fiscal 2019-20-year, Cabinet passed an Order in Council to raise the wholesale borrowing limits for ATB by $2 billion from $7 to $9 billion. This helped ATB to be “adequately capitalized” at both the Tier 1 and the Tier 2 levels. By the end of March 2020, notional capital had fallen to $253 million.
For the purposes of the analysis here, we only consider retained earnings as capital on which an adequate, optimal or risk adjusted rate of return can be earned.
Return on Taxpayers’ equity
Next we examine the return on the Government’s (Alberta taxpayers’) investment in this “bank-like” financial institution. Until 2003 when ATB was adequately capitalized, measurement of CEO performance against equity did not make sense. For example, the 144 per cent return on equity in 1999-2000 featured strong net income on a very low capital base.
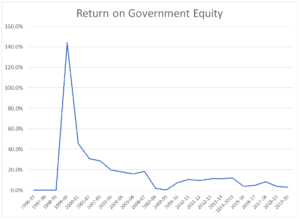
In November 2001, Bob Normand replaced Paul Haggis as CEO. In 2004, Normand’s base salary was increased to $340,000 and authority to determine “other aspects of remuneration” was delegated to ATB’s board of directors. In February 2005, Normand’s base pay was increased to $400,000. Beginning with 2003-04, ROE was excellent with returns to the government of between 16 per cent and 20 per cent. At that time these returns would have compared quite favourably to major banks’ ROE. It should be noted that the Alberta economy was growing very rapidly during this period.
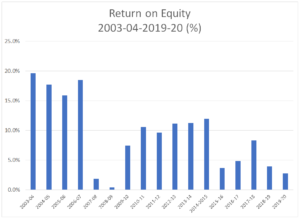

However, the following two fiscal years ATB’s performance was hammered by the ABCP crisis and recessionary conditions in 2008 and 2009. In 2007, Bob Normand, ATB’s President retired and Dave Mowat joined ATB as CEO with a base salary of $500,000.
By 2009-10, with the economic recovery well under way, ROE ranged from 7.5 per cent to a high of 11.9 per cent in 2014-15. This was a satisfactory return but still not near the rate enjoyed by its Big 5 competitors whose Canadian personal and commercial divisions would earn 20 to 30 per cent returns on equity (see Ascah and Anielski) Next followed a severe recession in Alberta which has lasted over the past five years. These times have been difficult ones for Alberta’s economy, workers and ATB with ROE ranging from 3.6 per cent in 2015-16 to 8.3 per cent in 2017-18, returns considerably less than during the 2004-07 period. A key question then is how did the ups and downs of ATB’s net income affect the CEO’s compensation?
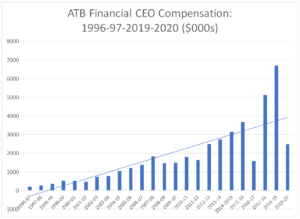
The chart above shows the total salary of ATB’s CEO since ATB was restructured. In 2004-05, the CEO’s salary hit $1 million and continued to rise each year until 2007-08, the year of the transition to Dave Mowat. In 2007-08, the year of transition between Normand and Mowat, the chart shows the total remuneration of Normand ($215,000) and Mowat ($1.618 million).
Under Dave Mowat, CEO compensation reached the $2.4 million mark in 2012-13 as the the effects of the ABCP provisions and Global Financial Crisis faded. In fiscal 2015–16, ATB implemented “a base salary freeze for all non-unionized team members, to recognize the challenges in Alberta’s economy and as part of our deliberate efforts to reduce expenses.” During this period Mowat headed up the province’s Royalty Review Advisory Panel.
CEO compensation grew to $3.7 million in 2015-16 falling significantly in 2016-17 even though net income rose by 50 per cent from the previous year. 2016-17 is somewhat anomalous when it was disclosed that the “incumbent (Mowat) has agreed to terminate the original post-retirement benefit and instead participate in an individual RPP and a SRP plan retroactively implemented in 2017 for all prior employment service. This enables ATB to reduce its costs substantially.”
Over the past ten years, ATB has steadily improved its disclosure on executive compensation moving from a three-page overview to a 20-page disclosure section. In 2015-16, corporate net income was the metric for short-term incentive plans. At least 50% of the target corporate net income must achieved for any payout to occur, “but in extraordinary circumstances board approval may be granted to award payouts when this target is not reached.” Long-term compensation would be based on actual “return on equity (ROE) performance, after payment in lieu of tax, measured against an ROE target determined by the board in advance.” There was however no reporting on what the board’s target was and how the actual result was measured.
In 2017-18, a key performance metric was changed which measured overall enterprise income before provision for loan losses. This change was highly significant as the Alberta economy was heading into a deep recession meant much higher credit loss provisions would be taken. Unfortunately for taxpayers however, excluding the impact of credit losses has the effect of immunizing the CEO and executive management from their collective role as prudent risk managers. Over the past three years, ATB’s provisions for credit losses have totalled $829 million against net income of $515 million.

Dave Mowat, President and CEO, 2007-2018
The figure below illustrates the portion of net income the CEO and four highest paid executives took home. The figure reveals the steady accretion of net income appropriated by the top management at ATB over the past 10 years.

In 2017-18, when net income rose by 82 per cent, Mowat’s salary rose by 217 per cent to $5.1 million. In June of 2019 Mowat retired after three months with pay of $4.6 million in a year when ATB’s net income had fallen by 30 per cent. On 1 July 2018, Curtis Stange, formerly ATB’s Chief Customer Officer, was appointed to succeed Mowat. His total compensation was $2.0 million and the year following, when net income fell by about 37 per cent, his total compensation increased to $2.5 million.

Curtis Stange, President and CEO, July 2018-Present Source: ATB.com
The chart below shows the relationship between net income and CEO salary.

Several issues stand out from the chart above. With the exception of 2018-20, where a new CEO was starting out at a lower salary, salaries of CEOs grew continuously upward with occasional dips due to macro-economic conditions such as the ABCP provisions and the economic recession in 2015-16. Should ATB CEOs accept the risk of these macro-economic variables or be insulated from their effects in an Alberta-centric financial institution where boom-and-bust is the norm?

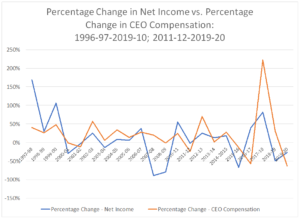
The above chart shows the relationship between the percentage change in net income with the change in the CEO’s compensation. 2009-10 is excluded because of 19 times increase in net income distorts the chart. Over the 22 years, the average increase in net income has been 12 per cent while the average increase in the CEO compensation has been 22 per cent.
Another way to examine the board decision-making on CEO compensation is to compute the number of times the CEO’s percentage salary gain (or loss) rose more (or less) than the percentage change to net income. The Table below reveals whether ATB or the taxpayer “won” the simple binary outcomes of who benefits the most – the owners or the CEO? The “winner” over the 16 year period was the CEO (10) but ATB’s owners also “won” 6 times.
| Fiscal Years | Percentage Change – Net Income | Percentage Change – CEO Compensation | “Winner” |
| 2003-04 | -14% | 7% | CEO |
| 2004-05 | 9% | 34% | CEO |
| 2005-06 | 6% | 14% | CEO |
| 2006-07 | 38% | 16% | ATB |
| 2007-08 | -89% | 33% | CEO |
| 2008-09 | -79% | 1% | CEO |
| 2010-11 | 56% | 31% | ATB |
| 2011-12 | -2% | -8% | ATB |
| 2012-13 | 25% | 52% | CEO |
| 2013-14 | 13% | 10% | ATB |
| 2014-15 | 19% | 14% | ATB |
| 2015-16 | -67% | 17% | CEO |
| 2016-17 | 39% | -57% | ATB |
| 2017-18 | 82% | 223% | CEO |
| 2018-19 | -49% | 31% | CEO |
| 2019-20 | -27% | 22% | CEO |
(Note: 2019-20 compares the compensation of Stange while the 2018-19 CEO compensation includes the final salary for the retiring CEO and Stange’s. If one compares Stange’s salary in the previous year with his salary in the year he became CEO, his compensation rose by 43 per cent.)
In general, ATB’s CEO has been handsomely compensated for delivering mediocre returns with the exception of 2004-07, and being insulated against macro-economic factors that were deemed outside the control of the incumbent CEO. It would therefore appear from the evidence that the chief beneficiary of this owner-employee relationship was the CEO, the board’s only employee.
Equity as Fairness
Above, we have discussed equity meaning the capital or “sweat labour” invested into a business enterprise. In this section, we discuss equity in the sense of justice or fairness. We do this by comparing the CEO’s salary with 1) average compensation of ATB employees, 2) returns to the owners/taxpayers, 3) compensation of the Premier and Deputy Minister of Finance and 4) salary and performance of the CEO of CWB.
As shown in the first figure above, average annual salaries have grown significantly over the past 23 years. The figure below illustrates the ratio of CEO salary compared to average salary has moved up from 6 times to 45 times, and now is in a lower range of 20 times. Even considering the current level of 20 times this level is more than 3 times the original ratio.
The question is: should this result be fair to employees and the Alberta taxpayers? When considering the poor return on average assets and equity especially over the past five years, can one legitimately ask – is there a role for government in overseeing the taxpayers’/owners’ equity interest? With roughly $4 billion of stated equity of the taxpayers at stake, should not the elected representatives of the owners of this venerable public institution, be asking questions to ensure the safekeeping of the taxpayers’ scarce resources? As the government has delegated this authority to ATB’s Board (other than the base salary), is it now time to re-think that arrangement? This is particularly important given the broader economic and fiscal context when unemployment levels are high and private sector executives and public sector employees have seen their salaries frozen or cut.
The figure below shows the relationship between the Premier and Deputy Finance Minister since establishment of ATB as a provincial agency.
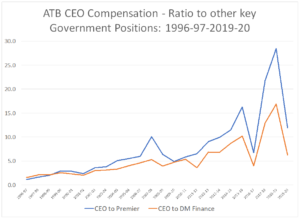
The above charts the evolution of ATB CEO’s compensation relative to the Alberta Premier and Deputy Minister of Finance, the senior most appointed official responsible for oversight of ATB. The upward sloping line confirms the upward drift of the CEO’s compensation against that of these senior public officials. From a ratio of 1.2, by the mid-2000s, the ratio grew to over 5 for the deputy minister while the ratio for the premier was considerably higher. (Permanent officials historically earn more than elected officials.) The ratio then fluctuated as high as 12 but has drifted lower with the latest ratio above five times.
Is this ratio fair? The premier and the deputy finance minister have, arguably, the toughest jobs in the province. However to attract capable bankers requires ATB to match what its peers are paying. This claim is valid only if the circumstances of the peers are the same as ATB’s. Clearly not. It could be argued that the base pay range for the Governor of the Bank of Canada ($468,100-550,000 in 2017-18) should be sufficient for the head of a government owned deposit-taking institution, that is legally an agent of the Alberta Crown- that is an extension of the Alberta government.
Comparison with a Peer
How does the pay and performance of ATB and its CEO compare with its closest competitor- Canadian Western Bank (CWB)? CWB is the best comparator because ATB and CWB compete directly in the lending and deposit-gathering business and, to a lesser extent, retail markets in Alberta. Moreover, the greatest challenge for an Alberta-based institution is to manage the booms and the busts, which CWB and ATB must do. Lastly, ATB lists CWB as one of the peer group to compare with and CWB, likewise, has ATB Financial in its peer group.
There are differences though. In CWB’s case there are short-term and long-term incentives plans payable in cash but also in stock options. Stock options are a form of taxable income where the grant of shares is based on a “strike” price which generally is the market price on the day the compensation committee recommends acceptance to its board. The CEO may exercise the option by receiving the shares on the date fixed by the Board by either selling the shares realizing taxable capital gain or hold on to them. At ATB, all pay is in cash and therefore taxable as income. ATB has no such linkage to external market performance. CWB directors that decide on the CEO’s compensation also receive much of their pay in stock. CWB directors therefore have a financial and longer-term interest in the performance of the company which is judged by external analysts and stock market prices, not by a government-appointed board.
Another difference is CWB has operations outside Alberta, but still operates mainly in resource-based provinces, although it has entered the national market over the past five years. CWB’s asset size is considerably smaller than ATB’s and, without much of a branch network, CWB does not have the stability of ATB’s large retail branch network nor enjoy the 100 per cent deposit guarantee of the provincial government. Up until about 2010, CWB relied on a more expensive deposit agent network.
In the chart below the return on average assets is compared on an after-tax basis. Since ATB does not pay taxes, the effective tax rate of CWB was used to adjust the return until 2009. (From 1996-2009, CWB’s effective tax rate ranges from about two per cent to 35 per cent.) In 2009-10, ATB began making a payment in lieu of taxes of 23 per cent of net income and we use after payment in lieu of tax net income to compare with CWB.

As shown from the figure above, CWB’s return on average assets has been quite stable over the past two decades. The jump in 2015 is a result of profits taken from the sale of an insurance subsidiary. In contrast, since 2007 ATB’s ROAA has been quite erratic due in the main to the ABCP provisions and the 2016-17 recession. ATB’s trendline is decidedly downwards and is expected to persist as ATB expects to record a $250 million annual loss (as disclosed in July’s First Quarter Fiscal Update). In comparison, CWB’s trendline is a gradual upwards slope, a trendline much desired by financial analysts.
It may be argued that ATB’s rural branch network is a financial burden on ATB and there is some truth to that. However, over the past few years, ATB’s personal and commercial business line “Everyday Financial Services” has been barely breaking even. Why has this iconic division’s net income not grown with ATB’s businesses? Have the investment bankers taken over ATB?
In the chart below we show the relationship between the pay of ATB’s CEO and ATB’s return on average assets.
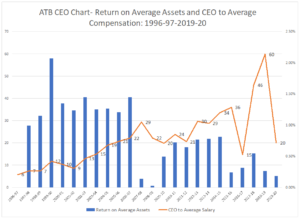
ATB CEO vs. ROAA
This chart is hardly flattering especially in 2018-19 when $4.6 million of total CEO compensation was for retiring CEO Dave Mowat. That said, the ROAA and CEO increases and decreases suggest some correlation with this measurement. 2007-08 and 2008-09 were years in which the provisions against ABCP were incurred and this problem was inherited from the previous CEO. (The ABCP problems were the subject of a report by the Auditor General in October 2008.)
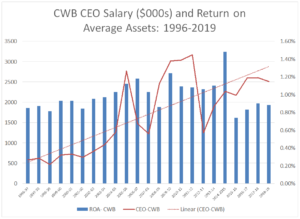
In the chart above, the CWB CEO’s compensation is the orange line and the blue column is the return on average assets. From 1996 to 2007, CWB’s ROAA increased slowly and in the years following the financial crisis returns fell. ROAA improved starting in 2009 with some fluctuations until the extraordinary gains generated from the sale of their Canada Direct insurance subsidiary in 2015.
In March 2013, long-time CEO Larry Pollock retired and, as is customary with transitions, the new CEO was paid at an “entry level,” below the predecessor to prove he or she is worthy. Over the next few years, CWB’s returns (with the exception of the 2016 bump) declined but starting in 2016, ROAA began to improve gradually with a slight decline in 2019.
In general, it appears CWB has generated considerably more wealth and steady income growth to its shareholders with the assumption of considerably more risk than that of a government-owned enterprise. Yes, it is true that there is some “political” risk with ATB’s top job. A new minister can change everything but a shrewd CEO’s contract negotiated with the board will or should have a pay-out if the political authority mettles to advance a partisan interest or arbitrarily takes a dislike to the CEO.
Implications and Opinion
Boards of directors face difficult choices when it comes to decision-making around executive compensation. Since Ontario adopted executive disclosure in the early 1990s, there has been a huge market created for human resources consultants, pension consultants, and tax and securities lawyers. Today’s management proxy circulars are now 40-100- pages disclosing the intricacies of executive compensation and well as directors’ compensation practices. In certain respects, the exercise is a privacy invasion and doubtless raises concerns about personal security. That said, the genie was out of the bottle and corporations’ management and boards had to cope.
As with any large organization like ATB, management and boards turn to specialists: lawyers, accountants, actuaries, and HR specialists. In the case of provincial corporations like ATB and AIMCo, which are trying to play catch up, the goal is to create the “right alignment” between the goals of the owner (taxpayers) and management. How do we incent management to perform at a level that is, for instance, comparable to or exceeds the performance of a regional bank like CWB?
Conceptually this is very hard because a government owned entity like ATB has different goals than keeping the stock price rising. In the case of a provincial corporation, the goals are often confused. Is the goal of the Minister and Government to keep the corporation out of the headlines of the local newspaper? If so, the board and management and government are basically looking for the “good news story” which includes annual reports featuring prominent constituents or local businesses helped by ATB, or showering grants to arts’ organizations and various charities.
If one looks at ATB’s annual reports since around 2008 you will be greeted with testimonies of borrowers’ and marketing/communications fluff demonstrating the good works of the beneficent provincial agency known as ATB. Yes, there was the requisite 100 pages of mandatory disclosure but what politician would bother sorting through that?
This focus on the positive took its cue from the corporate social responsibility movement. In terms of compensation this necessitated a move to evaluating CEOS and executives on a “balanced” scorecard basis. The scorecard measured such things as “employee engagement” and “customer satisfaction.” This meant more lucrative work for consultants to run these surveys with winners featured in national newspaper competitions. Such structures add overhead to the expenses of the corporation and thereby reduce profit to the owners. This industry has become of fixture in “good governance” practices and helps in rationalizing both management and board pay and pay structures. Transparency is viewed as the disinfect ridding companies of overpaid executives and directors. However, in Canada shareholders do not have the right to reject executive compensation proposals- there is a “say on pay.” Even large institutional investors can only “withhold” a vote for a director- they cannot vote against a director. The results of the vote may be “taken into account” by the board nominating committee for next year. A cynic might be accused of calling this a sophisticated inside job. However, governments as the sole shareholder do have the ability to decide on their own what they should be paying for.
In the case of ATB, it is uncertain whether the 100 per cent owner has even asked questions about the high levels of compensation in the face of poor results. It was with this in mind that the UCP may have wanted to send a signal to ATB’s board that ATB itself must be more profitable. In Bill 22, a new section 1.1. was added clarifying in legislation for the first time that ATB in carrying out its business objectives shall:
(a) manage its business in a commercial and cost-effective manner,
(b) seek to earn risk-adjusted rates of return that are similar to or better than the returns of comparable financial institutions in both the short term and the long term, and
(c) avoid an undue risk of loss by prudently managing its business, which includes establishing and implementing relevant plans, policies, standards and procedures.
Perhaps some members of the board believe this change was irrelevant because ATB was already meeting its business objectives according to this mandate! Whether this change was a signal from the minister he expects better performance, it is not clear. The NDP’s opposition spokesperson for Bill 22, Christina Gray was wary of the impact of this change on borrowers “concerned that it could mean fewer business loans, fewer supports in rural Alberta, and a change to how ATB manages its business.” This former cabinet minister’s perspective on the role of ATB appears to now be at odds with the UCP government’s “risk-adjusted return” mantra. If Minister Toews is serious about ATB’s performance, he should also be more curious about asking his board of directors how they reconcile pay with performance at ATB- a problem that appears he inherited.
CEO Compensation slides final(also available in PDF)
Full article ATB CEO Executive Compensation
Related Posts