|
CAUTION: Writing this blog has been the most challenging undertaking since I began Albertarecessionwatch.com (now Abpolecon.ca) four years ago. Writing about a former employer and one of the “Crown jewels” of Alberta’s public sector and knowing so many former colleagues still working at ATB creates a dilemma when examining critically this institution’s financial condition. ATB’s financial condition should be of interest to all Albertans who have a stake in the success, or failure, of this venerable institution. This post has been frustrating to write because there is so much information available on banking institutions used to compare ATB’s performance. The ocean of financial information has so many layers built up over years by both internal organizational dynamics as well as external regulatory requirements. While accounting and regulatory rules dictate standard presentations, there remain significant differences as each bank is organized differently, operates across a range of industries (investment banking, commercial and retail banking), geographies, product lines, and therefore compile information differently. And finally, organizations which report publicly do so to present financial results in a way that, for lack of a better word, comforts their shareholders, regulators, and business clients. This is so, since banking more than any other business is built on trust. This post therefore comes with this caution- I have endeavoured to present objective factual information in an objective way to be fair. Like any commentator I have my own biases which play into the issues and themes addressed. The analysis and opinions is not based on having access to an group of CFAs or sources inside ATB. I alone am responsible for any errors and omissions. |
Overview
Financial statements for corporations, like banks and insurance companies, have become increasingly incomprehensible even for those familiar with accounting policies and regulatory requirements. When I left ATB over ten years ago, International Financial Reporting Standards (IFRS) weren’t on the scene and the internal ratings-based system (IRBS) of new Basel reporting requirements were just beginning.
On top of these significant changes, the Financial Stability Board’s Enhanced Disclosure Task Force (EDTF) report entitled “Enhancing the Risk Disclosures of Banks,” led to a whole host of additional reporting requirements. Additionally recommendations of the Bloomberg Task Force of the Financial Stability Board were aimed at improving financial disclosures on climate change effects, challenges and strategies. As this post will share, complexity is the way of the world and presents immense challenges to ordinary citizens and politicians who might wish to break through the arcana of regulatory, legal and accounting matters, to distill what is really going on.
A key differentiator between Canadian banks and ATB is that chartered banks are privately owned with shares trading on stock exchanges. Banks are continually issuing subordinated debt, common and preferred shares requiring a receptive capital market to survive under the rigours of the market system.
Unlike chartered banks, ATB’s management is immune from the prying eyes and questions of equity analysts (and seemingly even the Public Accounts Committee). However, credit rating personnel do request and receive information from the province on ATB. Moreover, agency staff may interact directly with ATB staff. Ultimately, ATB relies on the quality of the province’s credit rating for its funding activities. As Abpolecon.ca has previously reported, ATB’s performance is attracting attention of the province’s credit raters given its large deposit liabilities and Alberta-based loans, all underwritten by Alberta taxpayers.
Key Drivers for ATB and banks
The important “drivers” of financial institution performance include the net interest margin (NIM), or the spread between interest paid on deposits and the interest earned on loans. A second driver is the efficiency, or expense ratio, measuring operating expenses against total revenue of the institutions – excluding provision for credit losses.
Assessing the quality of the loan book is a major driver of results and is measured in many ways. Provisions for loan or credit losses (PCLs) are an estimate of what portion of loans are expected to go into default and what the potential realization of the loss might be. Vast amounts of data are generated by credit agencies like Equifax and TransUnion and within institutions on clients and industries that help in estimating the potential for loss. Complex modeling is carried out to predict loan losses (Box A).
Box ADifference between the Provision for loan loss (PCL) and Allowance for Credit Losses (ACL) First, the PCL appears on the income statement while the ACL appears on the balance sheet. Second, the ACL is the product of the balance of the ACL at the beginning of the period with adjustments made for recoveries (+) and write-offs (-), and the PCL (+), changes in risk parameters (+ or -) and various transfers among three “stages” of risk. The result of all this is the balance of the ACL at the end of the period, which is subtracted from total loans on the balance sheet. The PCL is a complex amalgam of subjective judgment and objective factors used to determine expected credit losses at the statement date. A complex financial model includes a loan’s (1) probability of default (PD); (2) the actual loan balance at default or exposure at default (EAD); and (3) the loss given the default (LGD). Under IFRS 9 accounting rules, this calculation requires the categorization of loans into three stages (1-3) where Stage 1 is less risky loans, Stage 2 is elevated risks, and in Stage 3 the loan becomes impaired. Financial institutions are required to keep track of the “migration” between these various stages. At ATB the model is based on “three probability-weighted scenarios (pessimistic, baseline and optimistic) designed to capture a range of possible outcomes associated with different PDs, EADs, and LGDs, and probability of occurrence.” This model uses basic economic data including the unemployment rate, housing starts, interest rates, oil prices, and foreign exchange rates |
The PCLs can have dramatic impacts on the profitability of banks, as the last quarter reporting period (30 April) demonstrated. While all banks in this comparison remained profitable in their recent quarter, the hit to profits from PCLs was hard, with net income of banks falling by roughly 50 per cent. In the case of ATB, on a quarterly basis, ATB went from an $82 million profit to a $93 million loss.
A final driver is diversification of the loan book. How much of the loan book is consumer vs. commercial? How exposed are institutions to more volatile sectors, like oil and gas, hospitality and real estate, which now face significantly lower revenues? ATB’s exposure to Alberta is a key differentiator. National institutions’ loan books are more diversified geographically and by industry which protects, or is a hedge, against volatility experienced in resource dependent regions.
Recent Performance
A comment about ATB’s performance up to the end of 2019 is necessary before reviewing ATB’s financial results reported on 28 May.
At the end of December 2019, ATB’s net income had improved somewhat but loan growth had stalled. On the deposit-raising front, the Third Quarter report showed wholesale borrowing, through the provincial Finance ministry, increased dramatically ($2.4 billion) since the end of September, or by nearly 100 per cent. Provision for loan losses had remained relatively low and was lower comparably to the nine-month period in 2018-19. Operating expenses at ATB continued to rise: salaries were up about 10 per cent and total operating costs by about 6 per cent on a nine-month basis.
Other challenges were the poor profitability of the retail branch network. The retail branch network, known as “Everyday Banking Services” (EBS), lost $30.9 million last year while Corporate Financial Services (CFS) earned $73 million. However, EBS’s asset base was 40 per cent higher than CFS’s base.
Given CFS’s loan book’s heavy reliance on energy and commercial real estate loans, given the oil price collapse on 9 March, combined with COVID-19, one would expect ATB’s results to be dismal. For example, one would have expected that the massive provisions taken in 2016 ($387 million) would have been easily superseded in 2020 ($385 million).
Massive provisions would have been consistent with Premier Kenney’s claim that the economic climate was the worse since the 1930s and the provincial deficit would be three times that forecast at the end of February. Yet, for the full fiscal year, ATB was able to report a profit to the Finance Minister of $103 million. In fairness, this point was also acknowledged on page 67 of the Annual Report (“Alberta is facing the deepest recessions since the 1930s”).
Still the question remains: are ATB’s results consistent with the worse economic environment since the 1930s?
ATB Compared
The comparison relies on disclosures from six major banks and two regional banks, Laurentian Bank, headquartered in Montreal, and Edmonton-based Canadian Western Bank (CWB). ATB’s operations are similar in nature to Laurentian in respect of its business mix of both retail and commercial banking. ATB is similar to CWB which operates primarily (but not exclusively) in resource-based western Canada. However, CWB’s business mix is heavily oriented to business and CWB does not have the extensive branch of ATB.
Banks report using various measures (net vs. gross, average daily balances, average loans) and use different definitions for their business loans and business structure making it difficult to compare performance. This analysis attempts to compare “apples to apples” but no pretence is made about pinpoint accuracy. Rather, we are trying to get a sense of the differences, their magnitude, and possible cause.
Table 1 presents an overview of ATB’s financial performance relative to its peers. Column 1 compares the efficiency ratio. Aside from Quebec-based Laurentian, ATB is performing well below its larger national peers and especially poorly compared to Edmonton-based CWB. Some of ATB’s operating performance could be attributed to the “public policy” mandate set by the government. ATB’s has always had a strong rural branch network but the mandate to offer financial services throughout the province means that many smaller branches are simply not profitable. However new legislation requiring ATB to “earn risk-adjusted returns that are similar to or better than the returns of comparable financial institutions in both the short term and the long term,” presents questions and challenges to ATB’s board and management.
ATB’s quarter-to-quarter reduction in net income (Column 2) is the highest of all institutions. This should not be surprising given its Alberta location and its energy and commercial real estate loan book (Table 4). Indeed, it is surprising there was not more red ink.
ATB is the most poorly capitalized institution as shown in Column 3. Column 4 illustrates the price-to-book ratio of the banks. This ratio compares market capitalization (price of the stock multiplied by the number of shares), with the sum of the equity and retained earnings. A low value, less than one, means buyers would not pay full value (a ratio of one) for the entity. Higher values mean that investors will pay more because of the higher capacity of the institution to reward investors through rising dividends and a rising share price. Laurentian and CWB are clearly penalized by having regional loan concentration.
The comparison suggests that, were the Kenney government to put ATB up for sale, the price received would likely be well below the stated value on the province’s balance sheet.
Table 1- Overview |
||||||||||||||||||||||||||||||||||||||||||||||||||||||||
|
Institution |
Expense /Efficiency Ratio (1) |
% Change in Net Income (2) |
Common equity % of Risk Weighed Assets (3) |
Price/Book Ratio 30 April 2020 (4) |
||||||||||||||||||||||||||||||||||||||||||||||||||||
|
ATB Financial |
70.0% |
-214% |
9.7% |
N/A |
||||||||||||||||||||||||||||||||||||||||||||||||||||
|
BMO |
64.4% |
-57% |
12.2% |
0.91 * |
||||||||||||||||||||||||||||||||||||||||||||||||||||
|
BNS |
54.0% |
-43% |
10.9% |
1.1 |
||||||||||||||||||||||||||||||||||||||||||||||||||||
|
CIBC |
57.2% |
-68% |
11.3% |
0.99 |
||||||||||||||||||||||||||||||||||||||||||||||||||||
|
CWB |
47.1% |
-29% |
11.9% |
0.71 |
||||||||||||||||||||||||||||||||||||||||||||||||||||
|
Laurentian |
76.4% |
-128% |
10.8% |
0.59 |
||||||||||||||||||||||||||||||||||||||||||||||||||||
|
National |
53.1% |
-32% |
14.1% |
1.45 |
||||||||||||||||||||||||||||||||||||||||||||||||||||
|
Royal |
57.5% |
-58% |
13.4% |
1.54 |
||||||||||||||||||||||||||||||||||||||||||||||||||||
|
TD Bank |
48.6% |
49% |
13.6% |
1.20 |
||||||||||||||||||||||||||||||||||||||||||||||||||||
|
N/A- not available. * https://ycharts.com/ |
||||||||||||||||||||||||||||||||||||||||||||||||||||||||
|
Sources: Banks’ Second Quarter 2020 reports to shareholders and supplementary financial information. ATB Annual Report 2019-2020 and Unaudited Financial statements for Quarter ended 31 December 2019. |
||||||||||||||||||||||||||||||||||||||||||||||||||||||||
(Un)justified OptimismTable 2 gives an overview of some credit quality metrics. ATB, in spite of being located in the worst economically hit region of Canada has a lower provision for loan losses than all the Big Six banks. Why might that be the case? Perhaps ATB’s credit department, executive and board remain optimistic about the province’s economic and financial future? Or perhaps ATB believes that its lending, documentation, foreclosure, and collection practices are more rigorous than their competitors? Table 4 shows, ATB’s loan exposure to oil and gas is double or more than that of its peers and more than ten times the exposure of CWB. In the case of commercial real estate, ATB’s exposure is much greater than other comparable financial institutions, except CWB. In hospitality, some banks report the exposure, but many do not. In ATB’s case, hospitality could be subsumed by commercial real estate, but we do not know. Furthermore, hospitality lending might be split between two business segments, Business & Agriculture and CFS. Big banks disclose more of their business sectoral exposures (see Panel A below from CIBC) than that provided by ATB. Panel A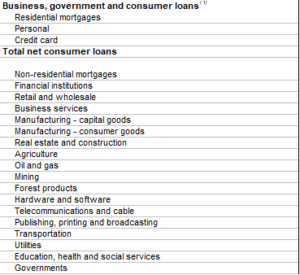 ATB only reports its exposures to commercial real estate, oil and gas, and agriculture. It was only in 2018 ATB re-commenced a sectoral breakdown of its commercial loan book. But why the secrecy? Although ATB is not the size of RBC, it is roughly double the size of CWB. CWB does provide some reporting on its sectoral exposure (5 commercial categories). Undoubtedly, this type of break-down is available (or should be) to the credit committee of ATB’s board and to rating agencies. Still, Alberta taxpayers, who ultimately are on the hook for ATB’s liabilities, are entitled to more transparency, rather than being treated like second-class owners. For investors in Government of Alberta securities, they too should have a better understanding about where credit is being allocated. |
||||||||||||||||||||||||||||||||||||||||||||||||||||||||
Credit QualityIn Table 2, ATB’s provision for credit (loan) losses seems rather low given what the Canadian banks are reporting. ATB’s provision is one half that of the largest banks. That said, net write-offs as a percentage of loans is very high when compared to other institutions. This higher figure means in the final quarter, ATB wrote off a large number of loan accounts. The annual net-write-offs – $351 million- was three times the level of the previous year. Business/CFS net write-offs surged by nearly four and a half times over the previous year. This might explain why the provision taken this year is lower because write-offs lowers the PCL calculation. By writing off the large amounts of corporate loans, this reduces the outstanding impaired loans.
|
||||||||||||||||||||||||||||||||||||||||||||||||||||||||
Table 3- Credit Quality (2) |
||||||
Institution |
% change in gross impaired loans(1) |
% change in gross impaired loans – oil and gas(2) |
% change in gross impaired loans – real estate and related(3) |
% Change in provision for credit losses(4) |
% Change in provision for credit losses- oil and gas(5) |
% Change in provision for credit losses- real estate and related(6) |
ATB Financial |
4.8% |
N/A |
N/A |
480% |
N/A |
N/A |
BMO |
29.2% |
65% |
-12% |
220% |
0% |
N/M |
BNS |
7.3% |
88% |
-3% |
139% |
38% |
-9% |
| CIBC |
17.4% |
143% |
28% |
441% |
1075% |
N/M |
CWB |
11.8% |
-5% |
98% |
162% |
N/A |
N/A |
Laurentian |
26.0% |
N/A |
N/A |
268% |
N/A |
N/A |
National |
10.8% |
36% |
-9% |
466% |
N/A |
N/A |
Royal |
20.2% |
92% |
-10% |
575% |
494% |
N/M |
TD Bank |
12.4% |
165% |
6% |
250% |
456% |
N/M |
N/A- not available. N/M- not material |
Sources: Banks’ Second Quarter 2020 reports to shareholders and supplementary financial information ATB Annual Report 2019-2020 and Unaudited Financial statements for Quarter ended 31 December 2019. |
|
|
Table 3 (Column 1) above illustrates that, where information is available on ATB’s loan portfolio, the growth in Gross Impaired Loans (GIL), compared to the banks, is quite low on a quarter to quarter basis. ATB’s GILs barely budged in a quarter that included the closure of large swathes of the Alberta economy and a brutal fall in oil prices.
Energy picture: ATB and banks
A part of the explanation of the low GIL increase could be the huge write-offs in its energy book taken in the final quarter, as mentioned. In fact the write-offs caused the Energy portfolio to fall by about $300 million over the quarter.
Examining the change in GILs and PCLs in the Energy book from the other banks points to a major gap in ATB’s disclosure (which purports to emulate its chartered bank competitors). Where reported, the change in provisioning has increased from 36 per cent to 165 per cent. One would expect the government as owner and the credit rating agencies to know what the energy loan book looks like, but Alberta taxpayers don’t seem to merit fundamental disclosures. Many banks do provide information about the quality of their energy loans through public ratings or their internal ratings system (Panel B is an example of Scotiabank’s disclosure of its energy book))
Panel B
Energy
The Bank’s outstanding loan exposure to commercial and corporate companies in the Energy sector was $21.6 billion as at April 30, 2020 (January 31, 2020 – $16.8 billion; October 31, 2019 – $16.6 billion), reflecting approximately 3.3% (January 31, 2020 – 2.7%; October 31, 2019 – 2.7%) of the Bank’s total loan portfolio. In addition, the Bank has related undrawn Energy loan commitments of $13.4 billion as at April 30, 2020 (January 31, 2020 – $13.3 billion; October 31, 2019 – $13.2 billion). The Bank has recorded credit losses on impaired loans of $22 million or 0.41% of outstanding loan exposure relating to the Energy sector during the quarter ended April 30, 2020.
Approximately 54% of the Bank’s outstanding Energy loan exposure is investment grade. Management’s focus pertains to non-investment grade accounts in the upstream and oil fields services subsectors. The Bank continues to consider the impact of lower Energy prices in its ongoing stress testing program.
ATB
The fact remains that very little is publicly known about the nature of ATB’s energy book other than the quantum of $3.6 billion. For example because the information on the allowance is buried under CFS, we do not not how much of the portfolio is impaired or in Stages 1 or 2. What is known publicly are gleaned from bankruptcy proceedings of Redwater Resources and Trident. One therefore might conclude that ATB’s energy loan book consists of mostly small independent producers. If this conclusion is accurate maybe the provision for loan losses is significantly understated. But maybe not.
Certainly ATB has and does participate in large syndicated loans to investment grade energy companies. But we do not have any information by which to know. Even in the Sanjel case, a very large oil servicing concern, which went bankrupt in 2016, owing creditors $883 million, court disclosure provides a shield under the heading of “syndicated loans” and senior bonds. Whether ATB was a creditor is difficult to know as many oil and gas companies, private or publicly listed, do not always disclose who their bankers are. But in a March 2020 regulatory filing, Bonavista Energy revealed that its draw request for $175 million would not be honoured by a banking syndicate which included ATB Financial.
The bottom line: ATB is not as transparent as its competitors and it is difficult to assess objectively the quality of its loan book without such information.
Loan Diversification
| Table 4 – Loan Diversification | ||||
| Institution | % of Loans- Oil & Gas | % of Loans- Real Estate | % of Loans-Hospitality | % of RML Loans- Alberta |
| ATB Financial | 8.2% | 12.8% | N/A | 100.0% |
| BMO | 3.0% | 8.3% | 2.5% | 12.9% |
| BNS | 3.3% | 5.8% | 1.0% | 13.3% |
| CIBC | 1.8% | 5.9% | N/A | 9.0% |
| CWB* | 0.7% | 29.0% | N/A | 31.5% |
| Laurentian | N/A | N/A | N/A | N/A |
| National | N/A | N/A | N/A | 7.6% |
| Royal | 1.3% | 8.9% | N/A | 13.5% |
| TD Bank | 1.6% | 10.1% | N/A | N/A |
Sources: Banks’ Second Quarter 2020 reports to shareholders and supplementary financial information; ATB Annual Report 2019-2020 and Unaudited Financial statements for Quarter ended 31 December 2019.
Banks
The Canadian banks take on the low level of oil prices was generally the same: provision for loan losses and impaired loans had increased. In BMO’s case oil and gas credit difficulties were lumped in with manufacturing, retail trade and service industries. Scotiabank’s boilerplate included the phrase “unfavourable macroeconomic outlook and lower oil prices that impacted the Energy sector globally.”
Notable among the banks was some reporting of undrawn lines of credit for energy loans. In Scotiabank’s case undrawn lines were $13.4 billion compared with outstanding loans of $21.6 billion representing a significant increase $4.8 over the previous quarter end. This would be attributable to energy companies drawing down on lines of credit.
It would be also be helpful to know the amount of undrawn commitments to the energy sector ATB has, particularly given the Bonavista situation. All we know is that at the end of March, undrawn commitments for the non-retail book was $11.1 billion, with $3.6 billion in the Stage 2 (medium risk) category- a sum equivalent to the loans outstanding to the energy sector.
CIBC noted the combined effect of lower oil prices and the lull in oil demand with rising provisions on oil and gas, retail and wholesale, and services sectors. CIBC stated that two-thirds of the oil and gas exposure was investment grade. CWB pointed to increases in its oil and gas portfolio due to increased draws from syndicated loans – consistent with the oil industry’s need for liquidity, supplied by the undrawn portion of the lines of credit.
Royal Bank offered an oil and gas forecast: ” oil prices to recover from the April 30, 2020 price of $19 per barrel to an average price of $30 per barrel over the next 12 months and $46 per barrel in the following 2 to 5 years.” Like the other banks, the Royal noted that higher provisions in the loans classified as impaired were “largely due to provisions taken in the oil & gas sector reflecting continued pressure on oil prices and the consumer discretionary sector in the current year.” The report also noted that the significance of the oil and gas sector in Canada, relative to that in the States which would delay Canada’s recovery relative to the U.S.
TD reported that drawn exposure to oil and gas companies was only one per cent with only about ten per cent of which was investment grade. TD also reported on its retail and small business exposure to Alberta, Saskatchewan and Newfoundland ($62 billion).
ATB’s Perspective
In characterizing the economic environment as “the deepest recession since the 1930s,” ATB’s annual report spoke of an economic recovery “slower than places less reliant on oil and gas production.” The report went on to acknowledge ATB’s Alberta exposure is the result of “our mandate to operate predominantly in Alberta.” The prospects of “dampened growth and increases in loan losses” are the result of the current, historic downturn in Alberta’s economy.
ATB addressed somewhat the recommendations of the Bloomberg Task Force stating:
ATB manages its exposure to energy price and economic volatility, where possible, through a series of credit risk management activities (outlined in the Credit Risk section below), including application of prudent underwriting standards similar to other Canadian financial institutions, and deployment of portfolio limits that ensure diversification of our portfolios. In addition, and as discussed above, ATB voluntarily complies with current OSFI capital adequacy guidelines and, pursuant to this compliance, ATB holds adequate regulatory capital to protect ATB from severe stress events.
In response to the current crisis events, management has implemented a series of actions. To support our customers and to facilitate temporary liquidity relief, we have deployed temporary credit relief programs sponsored either by ATB or the government. We are working through a series of activities to model potential impacts to our portfolios and are working closely with our clients to manage risk. ATB will continue to take an active role in evaluating and monitoring risks associated with energy and economic volatility.
ATB Annual Report 2019-20 page 92.
Segmented Approach
As discussed earlier, it is frustrating to compile data for ATB, which can be compared to other competitor financial institutions. In the Table below, we examine the PCLs of ATB according to loan type- problematic, especially with the residential mortgages (RMLs), credit cards, personal loans, and business loans.
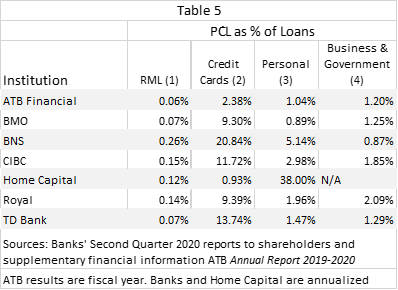
In Table 5, ATB’s provisioning seems woefully low given the twin blows of COVID 18, the oil price collapse, and the low investment taking place in the energy sector. Without putting too fine a point to this, it begs credulity as how ATB has apparently managed to dodge several bullets in negotiating through this period. Time will tell, but based on public pronouncements, all is seemingly under control.
Capital Adequacy
Capital for financial institutions represents the original equity invested, new equity raised, and earnings retained . Capital adequacy requirements (CAR) are set by supervisory bodies like the Office of the Superintendent of Financial Institutions. The current OSFI guideline is 57 pages, including 15 pages to define capital. In contrast, ATB’s guideline is 10 pages that includes in the definition of capital certain deposits and Long-term ATB notes- effectively money borrowed by the Alberta Crown to on-lend to ATB. In OSFI regulation, these deposits count as liabilities and not part of the capital.
In spite of the claim about “voluntarily” complying with OSFI Capital Adequacy rules and other standards, ATB is less well capitalized than its competitors. Some analysts might argue that capital is immaterial for a provincially-owned financial agency as the liabilities and assets (including equity) are assets and liabilities of the Crown anyway. However, speaking as someone who developed the original 1997 regulation, the implementation of the capital adequacy regime was specifically designed to build a capital base and to limit ATB’s leverage (capacity to grow its loan book).
But why should capital adequacy be a concern at this juncture? Firstly, capital is a cushion against the very losses that ATB is experiencing. A sound, capital base provides the owner (Alberta taxpayers) with an insurance policy against the very unusual circumstances Alberta is facing. Second, for large corporate depositors, the capital base gives additional assurance that ATB has the liquidity to repay deposits. In the case of bank failures in Alberta in the 1980s, it was the large depositors that are first to withdraw deposits when there becomes a concern about the institution’s solvency.
Naturally, large depositors would rely on the current credit rating of the province. And yet, the province’s credit rating has declined in relation to most chartered banks, making institutional deposit-raising a greater challenge. This challenge is shown by the rapid rise in wholesale borrowings between September 30th to December 31st. Although wholesale borrowings fell at 31 March, on that date the provincial Cabinet authorized a $2 billion increase in the wholesale borrowings for ATB. O.C. 108/2020 now authorizes the Minister of Finance to borrow and on-lend up to $9 billion to ATB.
Opinion
All the above is not to detract from the very hard work and effort accomplished daily by Associates in the finance, marketing, media relations, human resources, corporate secretary departments and Branch network staff who directly serve customers. All are increasingly specialists who hope to learn and hone their craft to raise their craft’s hourly rate. They are the workers who provide details on process, policies, compensation and governance practices to their executives and to the board.
These specialist skills now intersect with newly-formed board structures (Compensation and HR Committee, Governance, Risk management). In my opinion, these duplicative structures create a shield to restrict director liability. No longer are directors accountable so long as there was enough information disclosed (understood by an increasingly few individuals- read a prospectus), and they consulted with experts to deliver a decision (or received a legal opinion or a consultant’s report and recommendations).
As a Board “competence matrix” becomes increasingly fraught with caveats and complexities, how can reasonable observers hold that the board wasn’t doing its proper due diligence through exhibits of legalese and expert opinion? With so much routine, regulatory paperwork needing handling by the board, what time is left to consider the vital corporate – human questions:
- Who am I?
- Who are they?
- How do I grow?
- Why am I here?
- How am I doing?
It is the responsibility of executive management and the board to ensure the claim made in ATB’s latest report, “ATB has aligned its reporting standards to those of its competitors,” is true. If this is not the case, directors must start asking direct questions and understanding answers to these fundamental issues.
Yet an ATB’s director’s allegiance is to a political authority. This authority appoints them and can, at any time, terminate their directorship. It is therefore critical the Board and executive explain to the Alberta public how ATB’s loan loss provisions are fair and reasonable given the worst recession endured since the Great Depression.
More to explore- could credit default swaps have helped ATB through this period?
Excellent, comprehensive, and timely. ATB serves rural Alberta well and is clearly compromised vis a vis other banks by a mandate to serve Alberta only. Regardless, transparency in it’s reporting clearly needs improving.