On 21 May ATB Financial released its 2020-21 annual report before its virtual public general meeting. Media pick-up was light with Postmedia reporting the lukewarm results. ATB’s financial reporting over the past four years places great emphasis on “operating revenue” and not net profit. This would appear to fly in the face of a new statutory provision in the ATB Financial Act that requires ATB, in carrying on its business, to:
(a) manage its business in a commercial and cost-effective manner,
(b) seek to earn risk-adjusted rates of return that are similar to or better than the returns of comparable financial institutions in both the short term and the long term, and
(c) avoid an undue risk of loss by prudently managing its business, which includes establishing and implementing
relevant plans, policies, standards and procedures.
This year’s annual report, which now combines its corporate social responsibility report, is full of ATB’s good deeds in the community- which are important. The report provides cover against ATB’s low profitability levels and its quiet branch and agency closure project. Last year ATB shed 11 branches and decommissioned 21 agencies in a move to improve efficiency. ATB has also reduced about 300 employees over the past year as it shifts to digital delivery. In the following report, we examine how ATB compares against its peers and then examines the bizarre increases in executive compensation which belie common sense given the pandemic and how out of step ATB is in its compensation when compared with its so-called peers. 
The annual report continues the practice of calling ATB a “bank”- which it is decidedly not. ATB is a provincial agent of the Crown which means its liabilities- and assets- are those of the provincial government. When ATB talks about its risk management statement, no where is mentioned the most critical element of the Board’s function- to manage the agent-principal problem, that is ensuring that the Principal (Alberta Crown and taxpayers) do not allow ATB’s management to assume risks that imperil the Crown’s fiscal capacity.
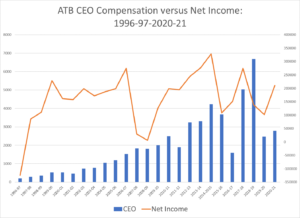
ATB’s results are poor when compared with its peers (see below). And yet, the results -a $210 million profit – are strikingly better than a realistic evaluation of ATB’s going concern risks entail. These risks include geographic risk concentration (recognized in the report) but the detail given is pitifully weak. ATB continues its disclosure practice of reporting the three largest commercial sector exposures – commercial real estate, oil and gas, and agriculture loans. While agriculture risk is consistent with ATB’s historical mandate and not a major issue, oil and gas lending and commercial real estate lending continue to be problematic in Alberta. Given the size of ATB’s loan book, it would be useful for the reader (and ASFI – Alberta Superintendent of Financial Institutions) to know how much commercial real estate is in Calgary and Edmonton office towers, hotels and for the rest of the province. It would also be useful for the reader to know how many oil and gas borrowers are rated above investment grade. This is especially critical as more than ever, the weight of institutional investment is departing the fossil fuels space. (See International Energy Agency Bombshell)
Financial Performance Compared
In the following charts we compare ATB’s annual performance against large and small chartered banks; performance in their latest reported quarterly reports. In the case of efficiency measures (Operating expenses/Revenue) ATB’s performance is below the banks. Similarly, ATB’s return on equity of five per cent is much lower than its peer group which ranges from ten per cent to 20 per cent. (At the bottom of the post you will find a PDF presentation with all the charts for better viewing.)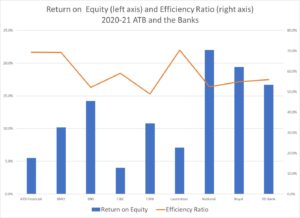

ATB’s ROE (left axis) is closer to CWB and Laurentian banks which have a concentrated geographic footprint. In the chart below ATB’s ROE since 2003-04 is tracked and indicates that ATB has not consistently produced returns on the government’s equity above 10 per cent. These numbers suggest that the goal of achieving comparable risk adjusted returns is elusive.
ATB’s efficiency ratio (right axis) -where a lower number is superior performance- remains worse than the peer group of banks that ATB includes in their compensation analysis. This is particularly true when compared against its cross -town rival Canadian Western Bank (CWB). CWB does not enjoy the 100% deposit guarantee, a A+ credit rating or lenient capital requirements test. Judging by the compensation increases the board seems to believe ATB’s management are achieving the government’s financial objectives.
The next chart provides historical context on ATB’s return on equity The sub-ten per cent return on equity starts in 2016 so there is certainly economic distress associated with ATB’s poor financial performance. However, CWB, an Edmonton-based institution can consistently returned superior performance even given its western Canadian footprint (discussed in more detail below).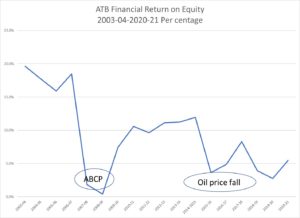
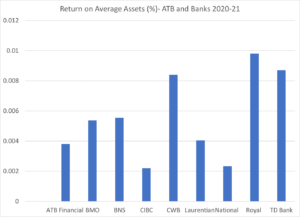
ATB’s return on average assets also lags its peer group, particularly CWB.
Compensation Compared
The Board of Directors is responsible for determining the CEO’s pay except for the base salary of $500,000 set by the provincial cabinet. The board, working through its Human Resources Committee, annually approves the CEO’s performance objectives. The Board Chair, in partnership with the HR Committee Chair, evaluates the CEO’s performance against pre-established objectives and approves all variable pay elements of the CEO’s compensation. According to the 2021 annual report, ATB’s compensation is aligned to the Government of Alberta
ATB’s compensation is designed for the competitive financial services market in which we operate, to attract and retain talent while demonstrating alignment with the GoA’s core compensation principles. These core principles require that compensation reflect a commitment to public service, diversity, and inclusion; is fair and consistent; is transparent to board members, employees, and the public; and is fiscally prudent. Under Alberta’s Reform of Agencies, Boards and Commissions Act, ATB’s executive compensation is reviewed by the GoA.

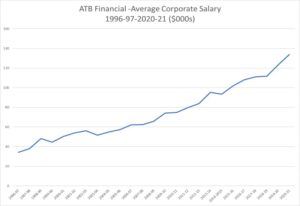
It would seem that the GOA “review” process did little to convey the message of compensation restraint which is a clear policy of Minister Toews. Toews has been the point person for the Kenney government in its efforts to obtain wage concessions from unionized staff since it assumed office. As shown below, either the government or the Board or both have been tone deal when it comes to rationalizing 10-20 per cent pay increases in executive pay all the while low pay workers in the public service are facing potential pay cuts or job losses. Indeed, with 300 fewer staff, this double standard is playing out. That said average corporate salary keeps going up as the number of staff fall. The chart below shows increases since ATB became a provincial agency in 1997.


In the charts which follow we illustrate the fiction that ATB’s executive compensation peer group should include Canada’s Big Six banks. The charts illustrate that ATB is a very small regional player compared to the major chartered banks or in ATB’s HR Committee one of ATB’s peers. However It may be objected that the compensation comparison with CWB is fair. While this is undoubtedly true, CWB’s performance is much more consistent and better than ATB’s has been for at least a decade
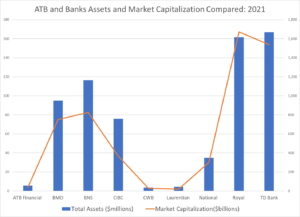
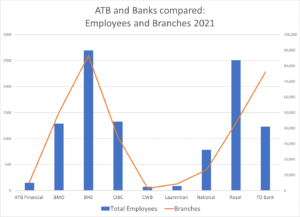
By these charts it becomes evident there is no comparison between the scale of the ATB’s operations and those of the large, complex multi-divisional, multi-national Canadian banks.
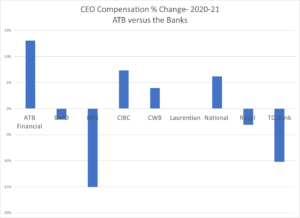
How do the compensation changes in 2020-21 for ATB’s CEO compare with his “peers?” The chart above shows that major bank boards were parsimonious with their CEOs. And for good reason- this was a period in which the banks’ employees and clients suffered immeasurable pain with COVID and disruptions to family and business life. This decision to increase compensation reads much like Air Canada’s move to award significant bonuses to executives while taking federal wage subsidies and a bailout package.
It is mind boggling to think that Alberta government ministers, senior Finance officials and ATB board members would not have thought about the ramifications of granting their CEO a 13 per cent pay raise under these circumstances. Perhaps they were labouring under the illustration that the CEO and senior executives were underpaid? Not only does the 13 per cent pay raise apply to the CEO- other three named executives took home pay increases between 14 and 20 per cent.
The chart below compares ATB CEO compensation against the average corporate salary. Last year the ratio was about 20 times roughly the same as last year but below peaks in 2018-19 when Dave Mowat retired and Stange took over ATB’s reins.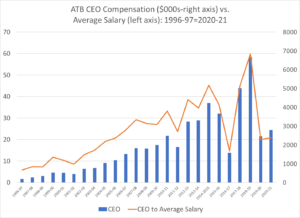
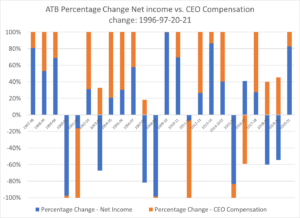
The chart below illustrates the relationship between CEO salary change and change in ATB’s net income. If the bar shows a preponderance of amber this means the CEO’s compensation increase, or decrease, was greater than the change in net income. In certain years, such as 2007-08 the CEO’s compensation went up and net income went down. This occurred because of a transition in CEOs and the ABCP losses originating from a previous regime.
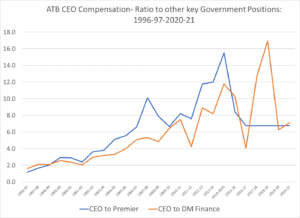
 The figure below compares the ATB CEO’s salary with Alberta’s Premier and Deputy Finance Minister. At six to eight times, one wonders why those who want to make money don’t enter public service- which is a real tragedy.
ATB Performance and CEO Compensation compared to CWB
Next we compare ATB CEO’s salary against its Edmonton rival, CWB. The first chart compares CWB and ATB CEO’s total compensation since 1996-97. The first chart below looks at ATB and CWB’s return on assets after tax. Prior to the implementation of a payment in lieu of tax (PILOT) system in 2007-08, ATB’s ROAA has been set at CWB’s reported effective tax rate.
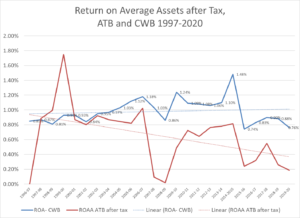
In the chart following, the lime=green line signifies the difference between ATB and CWB’s return on average assets. In the next chart we compare the CEOs’ compensation against the difference between the return on average assets of the two financial institutions. A negative number shows when ATB’s ROA has been below CWB’s. Except until 2006-07 ATB’s performance was superior. (In 1996-97, ATB recorded a very large loss, the ROAA differences start in 1997-98 when ATB returned to profitability.) ATB CEO’s compensation catches up in the 2012-14 time frame when Larry Pollock, CWB’s long-serving CEO retired. Since then, ATB CEO compensation levels remain high relative to CWB’s pay level, but ATB’s profitability continued to lag. 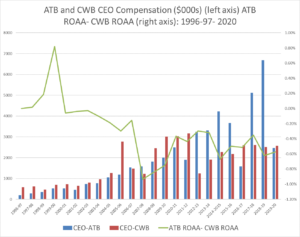
Opinion
The forgoing suggests that ATB’s board of directors are making compensation decisions which inconsistent with the shareholder’s express and legislated requirement to earn returns that are comparable on a risk-adjusted basis with ATB’s competitors. ATB’s performance relative to its peers has been woefully inadequate for some time. And yet, pay slips for ATB executives keep escalating. If the board would be transparent in disclosing how they conclude ATB’s performance is consistent with its peers-fair enough. For example, ATB could argue that it operates unprofitable branches and is responding to public policy mandates which add extra costs. If that is true, then the board should quantify these costs. Otherwise, followers of ATB”s finances and compensation practices are left to conclude ATB’s compensation decisions are not aligned to performance- a key rationale of performance-based compensation practices. Furthermore, such pay increases come at a time when “peers” have decided to reduce or hold compensation for their CEOs. Is this yet another example of a culture of entitlement which has dogged this government?
This in the face of many hard working atb employees who have not seen a wage increase for over 6 years and many have had their positions “red circled” to where they will never see an increase as long as they work there. I left this situation because of this.