How the Big Four with Big Five (banks)
In this post I compare the financial performance between the Big Four oilsands producers and the five biggest banks by examining their first half performance. For the Big Four the data is for thee first two quarters and first half ending 30 June 2022. Since the banks have a unique fiscal year end, I compare their first two quarters for the period ending 30 April 2022. The purpose is to inform readers of the relative economic, financial and political power of the two industries. This is achieved by presenting the following metrics
- Total Revenue
- Net Income after taxes
- Royalties payable (not relevant to banks)
- Taxes payable
- Taxes payable as per cent of net income
- Total equity or capital
- Net income as percent of total equity
- Share buybacks
- Dividends paid
- Debt repaid
- Market Capitalization
All the data is derived from the interim financial statements of these firms;
First half results
Given the rising price of oil after the Ukraine invasion, total revenue of the Big Four grew by 26 per cent quarter over quarter. A total of $119 billion was received by these four companies compared to $91-billion of the big banks. Note the difference between the banks’ Q1 and Q2 revenue – they are almost identical unlike the energy producers. Both groups derive a considerable amount of revenue from the United States so this revenue should not be considered only in the context of the Canadian economy. Comparing the revenues of only nine firms to Canada’s GDP in the first half of this year finds their $210 billion revenue represents an astounding 15 per cent of the Statistics Canada’s $1.4 trillion GDP estimate for Canada’s first -half GDP. This confirms why the Canadian Bankers’ Association and the Pathways Alliance hold so much sway in Ottawa and provincial capitals.
|
Total Revenue of Big Four ($millions) 2022 |
|||
|
Company |
Q2- 2022 |
Q1- 2022 |
H1-2022 |
|
Cenovus |
20,747 |
17,383 |
38,130 |
|
CNRL |
12,132 |
10,020 |
22,152 |
|
Imperial Oil |
17,285 |
12,657 |
29,942 |
|
Suncor |
16,135 |
12,420 |
28,555 |
|
Totals |
66,299 |
52,480 |
118,779 |
|
Total Revenue of Big Five ($millions) 2022 |
|||
|
Bank |
Q2- 2022 |
Q1- 2022 |
H1-2022 |
|
BMO |
9,318 |
7,723 |
17,041 |
|
Scotiabank |
7,723 |
7,827 |
15,550 |
|
CIBC |
5,376 |
5,408 |
10,784 |
|
RBC |
11,550 |
13,066 |
24,616 |
|
T-D- Financial |
11,263 |
11,283 |
22,546 |
|
Totals |
45,230 |
45,307 |
90,537 |
The first half of 2022 was particularly profitable time for the four companies as oil prices escalated following the 24 February Russian invasion. Second quarter income rose by 37 per cent for the combined companies compared to a still profitable first quarter. Suncor and CNRL were the most profitable firms mainly due to their larger production, reflected in the higher royalties paid by these companies. As reported in my article in The Conversation, Alberta’s finances are highly dependent on the profitability of the four companies.
|
Net Income of Big Four ($millions) 2022 |
|||
|
Company |
Q2- 2022 |
Q1- 2022 |
H1-2022 |
|
Cenovus |
2,432 |
1,625 |
4,057 |
|
CNRL |
3,502 |
3,101 |
6,603 |
|
Imperial Oil |
2,409 |
1,173 |
3,582 |
|
Suncor |
3,996 |
2,949 |
6,945 |
|
Totals |
9,907 |
7,223 |
17,130 |
Canadian banks have been notoriously profitable for decades and consequently attract political attention- as it should be. Most recently, the federal Liberals campaigned on taxing bank and insurance company profits collected during the time of COVID. The table shows how stable and profitable banks’ net income has been and this reflects a very long-term trend interrupted by periodic recessions in profits. The major oilsands producers are about half the scale today as five banks in total profits. BMO normalized profit in Q-2 was $2,187-million excluding the impact of divestitures and acquisitions.
|
Bank |
Q2- 2022 |
Q1- 2022 |
H1-2022 |
|
BMO |
4,756 |
2,933 |
7,689 |
|
Scotiabank |
2,747 |
2,740 |
5,487 |
|
CIBC |
1,518 |
1,864 |
3,382 |
|
RBC |
4,250 |
4,098 |
8,348 |
|
T-D- Financial |
3,811 |
3,733 |
7,544 |
|
Totals |
17,082 |
15,368 |
32,450 |
Next, we look at the government’s take in taxes from these highly profitable firms. In the case of the energy producers, royalties typically are as large or larger than taxes payable, but they are the resource owners’ return.
|
Royalties Payable ($millions) 2022 |
|||
|
Company |
Q2- 2022 |
Q1- 2022 |
H1-2022 |
|
Cenovus |
1,582 |
1,185 |
2,767 |
|
CNRL |
2,337 |
1,455 |
3,792 |
|
Imperial Oil |
430 |
280 |
710 |
|
Suncor |
1,680 |
1,132 |
2,812 |
|
Totals |
6,029 |
4,052 |
10,081 |
Both tables show the significant increase in royalties and income taxable payable in the April-June period compared to the previous quarter.
|
Taxes Payable ($millions) 2022 |
|||
|
Company |
Q2- 2022 |
Q1- 2022 |
H1-2022 |
|
Cenovus |
841 |
543 |
1,384 |
|
CNRL |
1,030 |
976 |
2,006 |
|
Imperial Oil |
757 |
361 |
1,118 |
|
Suncor |
1,413 |
899 |
2,312 |
|
Totals |
4,041 |
2,779 |
6,820 |
For the banks, their payments were higher in Q2 reflecting higher profitability. During the first half of 2022, both industries provided very significant sums to Canadian governments and, in the case of oilsands producers, for the Alberta government. Given Alberta’s very low corporate tax rate, these oilsands companies would claim as much taxable income as possible under an allocation formula respecting sharing of provincial corporate tax. Therefore Alberta would be by far the biggest recipient of corporate income of all provinces.
| Taxes Payable ($millions) 2022 | |||
| Bank | Q2- 2022 | Q1- 2022 | H1-2022 |
| BMO | 1607 | 962 | 2,569 |
| Scotiabank | 817 | 864 | 1,681 |
| CIBC | 436 | 531 | 967 |
| RBC | 1,055 | 1,289 | 2,344 |
| T-D- Financial | 1,002 | 984 | 1,986 |
| Totals | 4917 | 4630 | 9,547 |
![]() Another measure examines the relative tax load of the two groups. The table shows that CNRL pays the lowest proportion of tax while Cenovus pays the highest. It should be noted that the first half of 2022 illustrates high levels of profitability and the impact of declining capital expenditures by these companies. Declines in capital expenditures in the past were used to offset taxable income but that is less in today’s environment. The fact that the taxes payable are higher than the banks should not be over-emphasized. In the future, assuming the oilsands producers take advantage of the generous tax credit for carbon capture and underground storage facilities, their effective tax rate will fall.
Another measure examines the relative tax load of the two groups. The table shows that CNRL pays the lowest proportion of tax while Cenovus pays the highest. It should be noted that the first half of 2022 illustrates high levels of profitability and the impact of declining capital expenditures by these companies. Declines in capital expenditures in the past were used to offset taxable income but that is less in today’s environment. The fact that the taxes payable are higher than the banks should not be over-emphasized. In the future, assuming the oilsands producers take advantage of the generous tax credit for carbon capture and underground storage facilities, their effective tax rate will fall.
|
Taxes Payable Per cent of Net Income (%) 2022 |
|||
|
Company |
Q2- 2022 |
Q1- 2022 |
H1-2022 |
|
Cenovus |
34.6% |
33.4% |
34.1% |
|
CNRL |
29.4% |
31.5% |
30.4% |
|
Imperial Oil |
31.4% |
30.8% |
31.2% |
|
Suncor |
35.4% |
30.5% |
33.3% |
In the case of the banks, like the oil producers, there is an interesting variation of percentage of profits paid in taxes. In the case of the two largest institutions, Royal Bank and TD- Bank, their rates are seven to nine percentage points lower than Bank of Montreal. Numerous factors go into the calculation of bank income taxes, the most relevant of which is the degree to which their offshore subsidiaries can attribute net income to low tax jurisdictions. The Liberals tax increase on banks and insurers approved in the 2022 Budget will cause the percentage to rise over the next few quarters. Finance Canada estimates the “Canada Recovery Dividend” will raise $4.05-billion of tax revenue over the five year period.
|
Taxes Payable Per cent of Net Income (%) 2022 |
|||
|
Bank |
Q2- 2022 |
Q1- 2022 |
H1-2022 |
|
BMO |
33.8% |
32.8% |
33.3% |
|
Scotiabank |
29.7% |
31.5% |
30.6% |
|
CIBC |
28.7% |
28.5% |
28.6% |
|
RBC |
23.6% |
24.0% |
23.8% |
|
T-D- Financial |
26.3% |
26.4% |
26.3% |
|
Totals |
28.8% |
30.1% |
29.5% |
Equity- Capital employed
Another measure to compare the financial size of these two groups is to understand the amount of capital or equity deployed in the business. Judging by this measure, the Big Four are about one-third the size of the major banks although CNRL and Suncor’s equity position is comparable to CIBC’s. imperial Oil and Cenovus are only about half or two-thirds the size of CNRL and Suncor. Capital size is important in this industry because it governs how much a producer can borrow from a bank or public capital markets to expand production via an acquisition or building new facilities.
|
Total Equity ($-billions) |
||
|
Company |
Q2- 2022 |
Q1- 2022 |
|
Cenovus |
26,275 |
24,614 |
|
CNRL |
39,340 |
38,490 |
|
Imperial Oil |
21,979 |
22,276 |
|
Suncor |
39,765 |
38,274 |
|
Totals |
127,359 |
123,654 |
In the case of the banks there are three tiers. RBC and TD form the top tier, while BMO and Scotiabank are roughly two-thirds the size of the two biggest banks. CIBC is about one-half the size of RBC and TD. Capital in important because it governs the extend to which a bank can lend money and operate in other financial activities like investment banking and insurance.
| Total Common Equity ($-millions) | ||
| Bank | Q2- 2022 | Q1- 2022 |
| BMO | 65,592 | 59,804 |
| Scotiabank | 64,833 | 66,172 |
| CIBC | 47,754 | 47,103 |
| RBC | 97,006 | 91,114 |
| T-D- Financial | 90,173 | 88,791 |
| Totals | 365,358 | 352,984 |
Unlike bank profitability, oil company profitability is more volatile than bank profits which track generally the North American economies. The best measure to compare profitability is the return on equity (ROE) or return on the capital invested in the business. The accompanying table illustrates when compared with the five major banks, the Big Four’s ROE has surged well above bank levels due to the rise in oil prices. Average ROE rose dramatically in the second quarter to 31 per cent, an increase of about 33 percent. Cenovus, Suncor and Imperial were the main beneficiaries of price increases. Since these companies have a different mix of refining and upstream facilities, refining margins have been beneficial to Imperial (ESSO), Suncor (PetroCanada) and Cenovus which recently acquired Husky Energy. CNRL has limited upgrading and refining facilities.
|
Net Income as Percent of Total Equity (ROE- %) |
||
|
Company |
Q2- 2022 |
Q1- 2022 |
|
Cenovus |
37.0% |
26.4% |
|
CNRL |
35.6% |
32.2% |
|
Imperial Oil |
43.8% |
21.1% |
|
Suncor |
40.2% |
30.8% |
|
Total ROE |
31.1% |
23.4% |
At the present time the banks’ ROE returns are lower than the Big Four principally because of elevated oil prices. Banks’ ROE is traditionally quite stable as the industry responds to general economic conditions and operates across a North American market. Equity returns are quite similar across this oligopolistic industry with the notable exception of BMO noted earlier.
|
Net Income as Percent of Total Equity (ROE- %) |
||
|
Bank |
Q2- 2022 |
Q1- 2022 |
|
BMO |
29.0% |
19.6% |
|
Scotiabank |
16.9% |
16.6% |
|
CIBC |
12.7% |
15.8% |
|
RBC |
17.5% |
18.0% |
|
T-D- Financial |
16.9% |
16.8% |
|
Total ROE |
18.7% |
17.4% |
Capital management
![]() A key ingredient watched by investors is what companies do with their capital. Institutional investors want know if management is rigorously monitoring the deployment of capital in their various businesses (refining, manufacturing, exploration, environmental remediation, investment banking, retail banking etc.) to maximize returns to their stockholders. Capital management refers to the ongoing determination by management about the capital necessary to support the various businesses for regulatory and operating purposes (capital maintenance and replacement). Some institutional investors, such as hedge funds, have particularly strong views about how management can realize share value as we have recently seen with Elliott Management and Suncor earlier this year.
A key ingredient watched by investors is what companies do with their capital. Institutional investors want know if management is rigorously monitoring the deployment of capital in their various businesses (refining, manufacturing, exploration, environmental remediation, investment banking, retail banking etc.) to maximize returns to their stockholders. Capital management refers to the ongoing determination by management about the capital necessary to support the various businesses for regulatory and operating purposes (capital maintenance and replacement). Some institutional investors, such as hedge funds, have particularly strong views about how management can realize share value as we have recently seen with Elliott Management and Suncor earlier this year.
There are many tools for managing capital including issuing or repurchasing shares, issuing or repaying debt and paying dividends to shareholders. The table following looks at the share buybacks of the Big Four. CNRL, Cenovus, and Suncor have been particularly aggressive. It has become increasingly clear that oilsands producer will be unable to significantly increase their production so they are reverting to paying their mostly institutional investors by buying back shares or paying dividends, including special dividends.
|
Share Buybacks ($millions) |
|||
|
Company |
Q2- 2022 |
Q1- 2022 |
H1-2022 |
|
Cenovus |
466 |
1,018 |
1,484 |
|
CNRL |
2,005 |
1,078 |
3,083 |
|
Imperial Oil |
2,500 |
449 |
2,949 |
|
Suncor |
2,553 |
827 |
3,380 |
|
Totals |
7,524 |
3,372 |
10,896 |
Over the recent two quarters these companies have also repaid more than $2.9-billion in debt while buying back nearly $11-billion in shares. Unlike the oil companies, the banks have been relatively modest in their share buybacks. In fact up until the end of 2021 banks were prohibited by their federal regulator from raising dividends or buying back shares. This policy was adopted during the pandemic to ensure that financial institutions’’ capital strength was maintained in the face of fears that a severe economic downturn would impair the banks’ viability. This will change as banks have announced various share buyback programs. THe purpose is to reduce the shares outstanding thereby increasing earnings per share.
|
Share Buybacks ($millions) |
|||
|
Bank |
Q2- 2022 |
Q1- 2022 |
H1-2022 |
|
BMO |
– |
– |
– |
|
Scotiabank |
1,250 |
– |
1,250 |
|
CIBC |
134 |
134 |
|
|
RBC |
1,431 |
1,671 |
3,102 |
|
T-D- Financial |
1,431 |
– |
1,431 |
|
Totals |
4,112 |
1,805 |
5,917 |
These tables report dividend payments in the companies first half of 2022. All four companies have increased their dividends over the past quarter. CNRL announced a special dividend of $1.50 payable on 31 August which is not reflected in the numbers. The total distribution would amount to nearly $1.7-billion. There is a market expectation that oilsands companies will increase their dividends as their operations mature into long-term series of cash flows without need for significant capital to expand or maintain the business. Of course that are environmental liabilities like the tailings ponds for investors to consider.
|
Dividends Paid ($millions) |
|||
|
Company |
Q2- 2022 |
Q1- 2022 |
H1-2022 |
|
Cenovus |
207 |
69 |
276 |
|
CNRL |
871 |
689 |
1,560 |
|
Imperial Oil |
228 |
185 |
185 |
|
Suncor |
657 |
601 |
1,258 |
|
Totals |
1,963 |
1,544 |
3,279 |
By contrast the banks historically have followed a policy of paying dividends in a range of 40-60 per cent of their after-tax profits. With profits steadily rising, institutional investors can feel confident the dividends will not only be maintained but they will keep growing. This is almost guaranteed by the regulatory reputation of Canada’s bank regulator and perceived conservatism of Canadian bank management and boards. The five banks’ dividend distributions are currently about four times that of the four oilsands companies.
|
Dividends Paid ($millions) |
|||
|
Bank |
Q2- 2022 |
Q1- 2022 |
H1-2022 |
|
BMO |
617 |
741 |
1,358 |
|
Scotiabank |
1,269 |
1,169 |
2,438 |
|
CIBC |
736 |
731 |
1,467 |
|
RBC |
1,756 |
1,608 |
3,364 |
|
T-D- Financial |
1,605 |
1,617 |
3,222 |
|
Totals |
5,983 |
5,866 |
11,849 |
The final table shows how much debt the Big Four repaid in the first half of 2022. These numbers include short-term (bank) debt and long-term debt. Debt repayment provides managment more financial flexibility in managing their relationship with both institutional investors and credit rating agencies.
|
Debt Repaid ($millions) |
|
|
Company |
H1-2022 |
|
Cenovus |
-1,339 |
|
CNRL |
-1,588 |
|
Imperial Oil |
– |
|
Suncor |
-1,270 |
|
Totals |
-2,858 |
A final means of comparison is looking at how the market place values these firms. Final capitalization is capsulated by multiplying the total shares outstanding by the closing price of the common shares. The big banks dominate the list with CNRL ranking closely behind Scotiabank and Bank of Montreal. The Alberta company with the highest market capitalization is energy transportation company Enbridge worth $109-billion. TC Energy is worth $62 billion.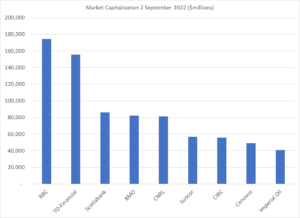
Opinion
Alberta’s Big Four are western Canada’s equivalent to Ontario’s Big Five banks. They are powerful financially, economically and politically. While the Big Four lobbying efforts are divided between Ottawa and Edmonton/Calgary, bank CEOs “only” have to worry about financial regulators in Washington and Ottawa.
The future relationship between banks and the Big Four will become an increasingly strained one as banks’ and energy producers’ fall under more stringent securities’ disclosure requirements on their emissions and net zero plans. Furthermore, international financial regulators will increasingly be watching exposure of banks to industrial sectors whose assets may become stranded due to more strident regulatory enforcement and rules.
There are many other measures to measure the impact of banks and oil companies on the respective communities they operate in. These include numbers of employees, donations to charities, capital spending, etc. Both groups operate in oligopolistic, highly regulated industries where government is a “partner” in their businesses. Banks’ influence over federal decision-making is potent but more diffuse since the banks operate over a wider political constituency. The Big Four carry more political weight because their operations are almost entirely in Alberta.
What is interesting about the complex relationship between the CBA and the Pathways’ Alliance is how they will interact as the climate emergency grows and more draconian environmental measures will be brought in by the federal government.
In a following post I examine who owns the Big Four. It provides a picture of widely distributed institutional ownership which is dominated by U.S. institutions..
Related Posts